
Learning Analytics Portfolio
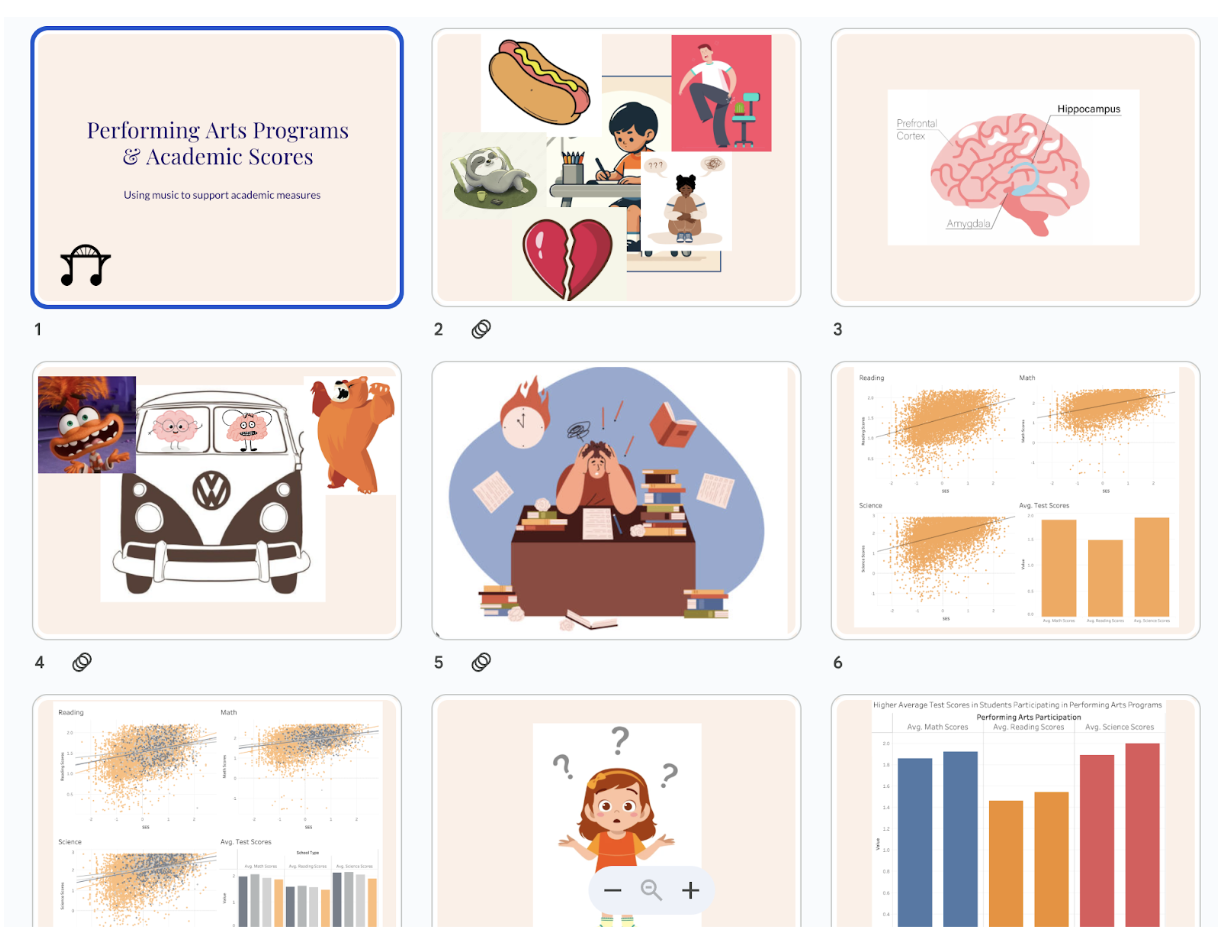
Performing Arts Programs and Academic Scores: Using Music to support Academic Measures
-
Visual storytelling of a quantitative analysis that integrates a compelling narrative with purposeful graphics in PowerPoint.
-
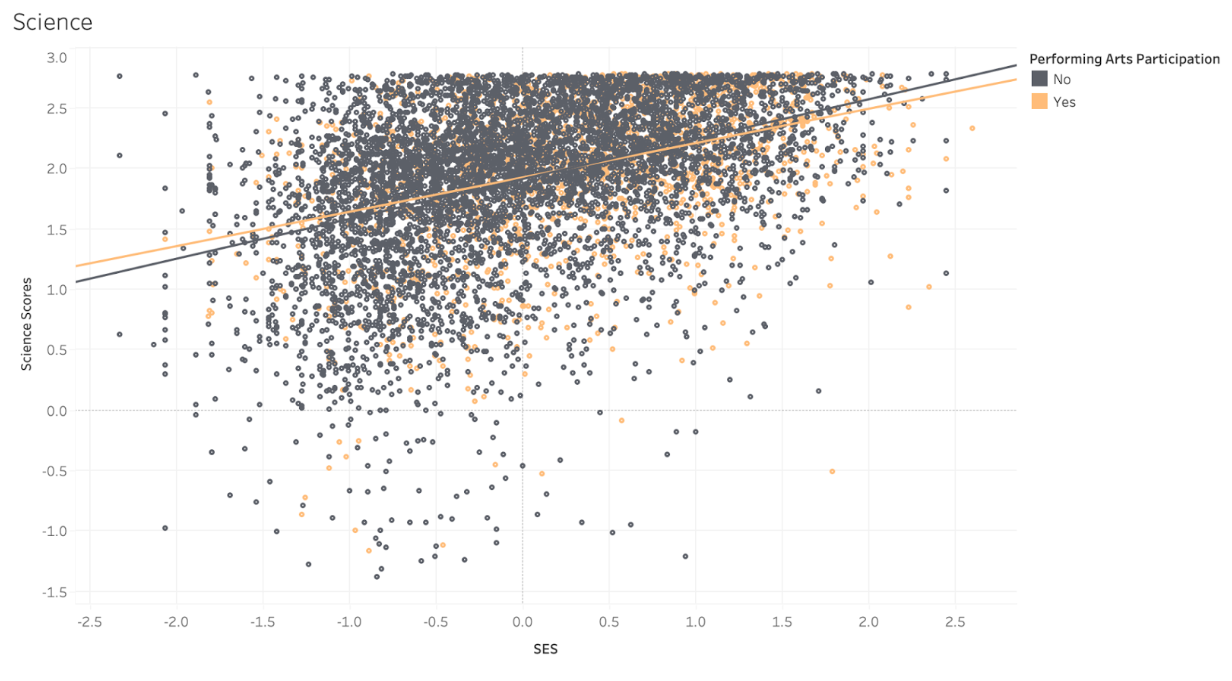
This presentation uses data visualizations and storytelling to explain how stress, socioeconomic status, and performing arts participation relate to academic outcomes. Designed for educators and school leaders, it applies principles including: visual focus, narrative structure, and brand arguments to build a clear story arc. The slides use images, transitions, and visual contrast to highlight how music-based interventions may support learning. Through this process, I refined skills in visual communication, narrative framing, and translating complex data into an accessible image-driven story.
Bridging the Gap Between Potential and Performance with Music
-
An executive brief written for a target audience explaining the primary purpose and results of a quantitative analysis.
-
This one-pager distils my 615 project into a clear message for district leaders, principals, and policymakers about how music therapy can help close achievement gaps for low-SES students. It explains the problem as chronic stress impacting learning readiness and summarizes my methods using ECLS data and research on music’s impact on the brain. I highlight findings showing higher scores for performing arts participants and reduced access in high-poverty schools. Creating this one-pager strengthened my skills in plain-language communication, data interpretation, and designing actionable messages for decision-makers.
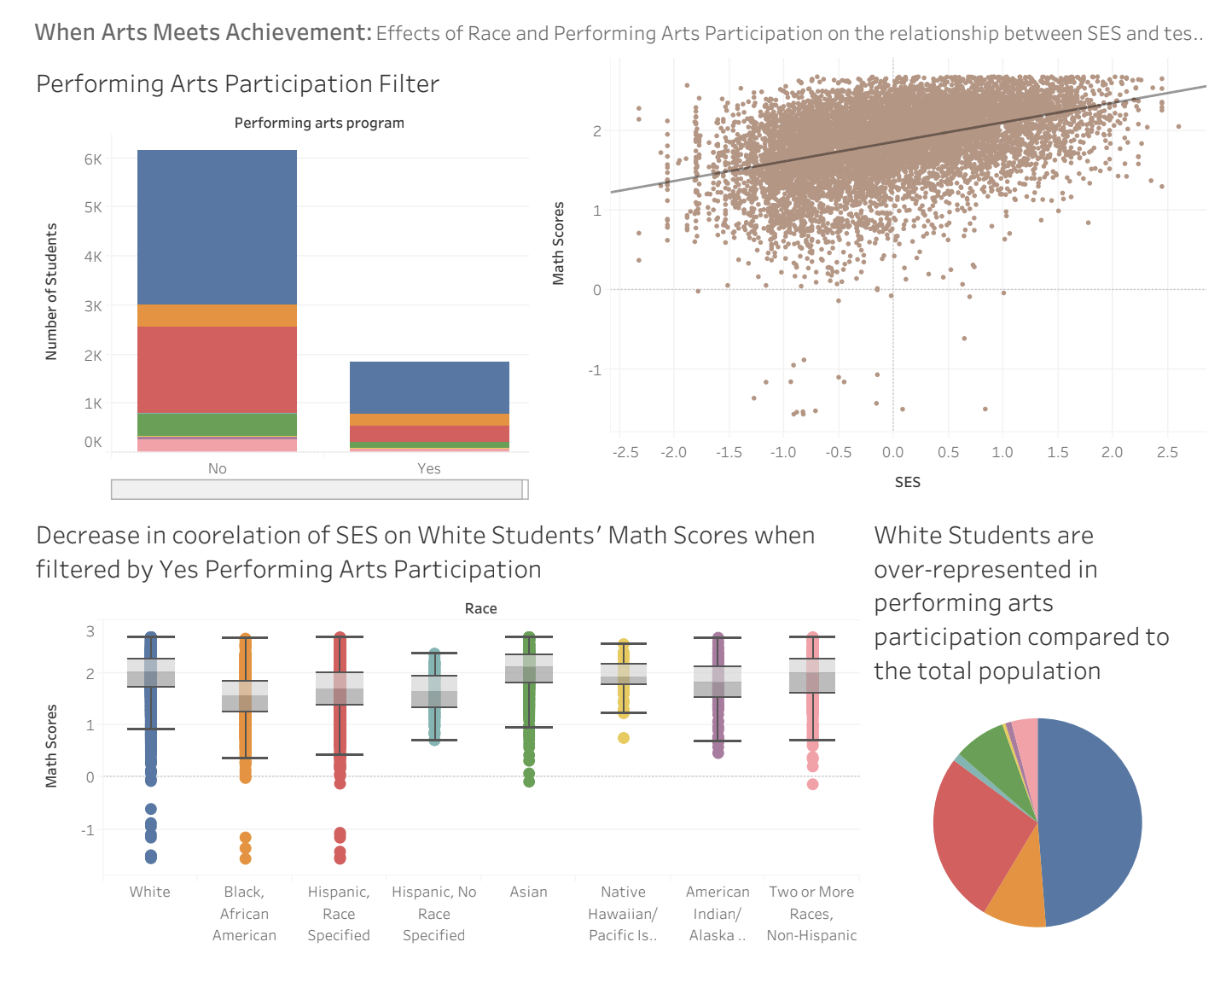
When Arts Meets Achievement: Effects of Race and Performing Arts Participation on Relationship between SES and test scores
-
An interactive and accessible data visualization dashboard using Tableau.
-
This Tableau analysis explores how SES, race, and performing arts participation relate to match scores, using visualizations designed for K-12 district leaders seeking equity insights. I created a simple bar chart, a complex scatter plot, and a dashboard integrating race-disaggregated boxplots and performing arts participation patterns. These visuals highlight two key findings: performing arts participation weakens the SES-math score relationship for White students, and White students are overrepresented in arts programming. Building this dashboard strengthened my skills in visualization design, refinement, and storytelling with data.
-
![]()
Learning Theory Application in Music Therapy Supervision: An evaluation of a learning environment using four theoretical perspectives from the learning sciences.
This paper analyzes a supervision meeting between a music therapy intern and supervisor through four learning theories: distributed cognition, situated cognition, narrative intelligence, and expertise, to interpret and improve instructional practice. Designed for program faculty and clinical educators, it draws on direct observation, note-taking, and theoretical application to evaluate learning interactions and propose interventions. The analysis reveals how tools, storytelling, and reflective practice shape professional learning. Through this process, I strengthened my skills in theoretical analysis, observation, and translating learning science into actionable improvements.
-
![]()
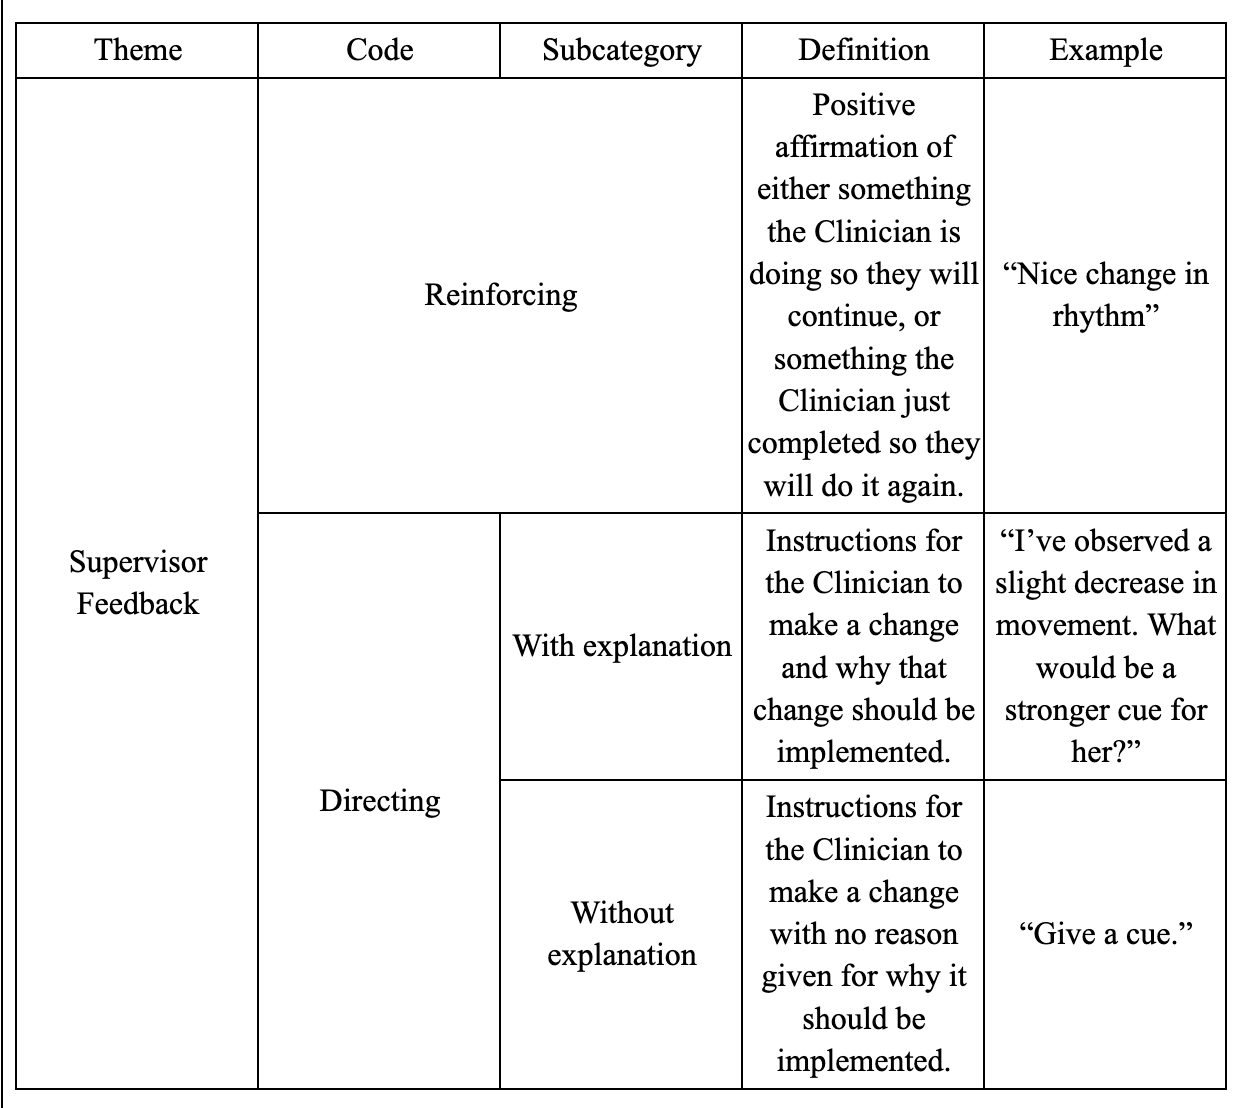
Qualitative Music Therapy Supervision Study: A qualitative analysis drawing on original observations and interview data.
This final paper reports a qualitative study of in-the-ear supervision in a music therapy company, exploring how supervisors’ real-time feedback balances clinician learning with client care. Intended for clinical supervisors, training directors, and practice leaders, the report draws on virtual observations, field notes, and semi-structured interviews analyzed thematically. I identified categories of feedback (directions with/without explanation, reinforcement) and their functions, generating implications for training and supervision design. Through this project, I strengthened skills in qualitative coding, thematic analysis, and combining theory with data into concrete recommendations: with more time, I would add longitudinal and demographic data.
-
![]()
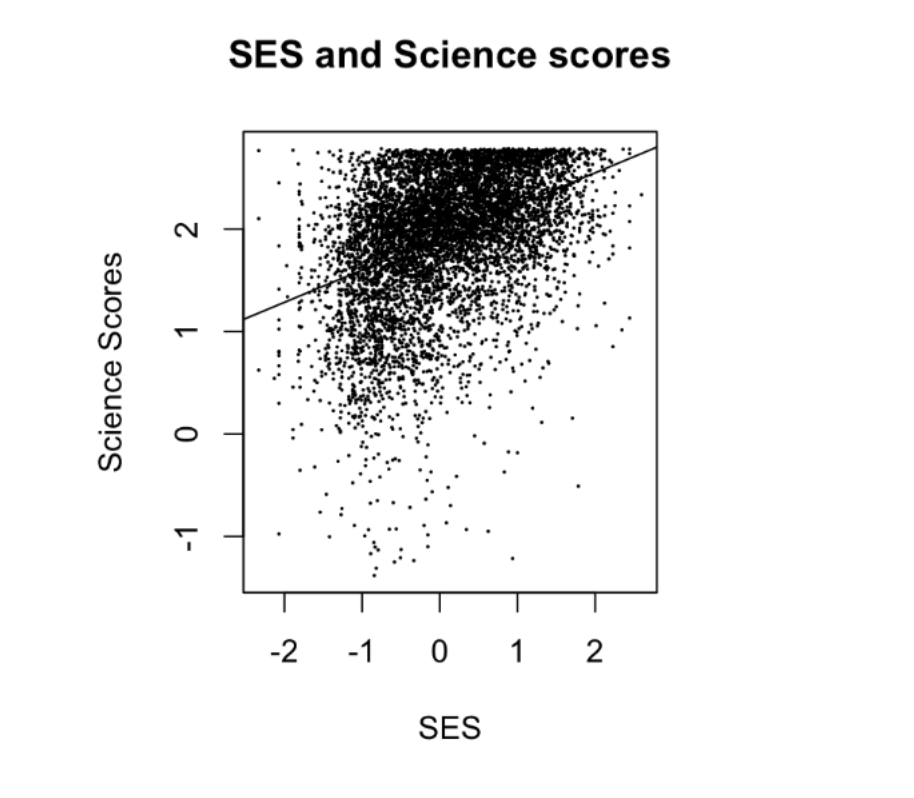
Science Success and Socioeconomic Status: A quantitative study using regression in R.
This final paper presents an independent quantitative study examining how socioeconomic status predicts 5th-grade science achievement using regression techniques. Written for K-12 education stakeholders and policy makers who rely on data to guide equitable decision-making, the study synthesizes nine research memos into a full empirical analysis. It incorporates descriptive statistics, visualizations, diagnostics, and a theoretically informed final model. The revision process strengthened clarity, interpretation, and policy relevance. Through this project, I deepened my skills in model specification, data interpretation, and academic writing, producing findings that can meaningfully inform resource allocation and intervention strategies in schools.
-
![]()
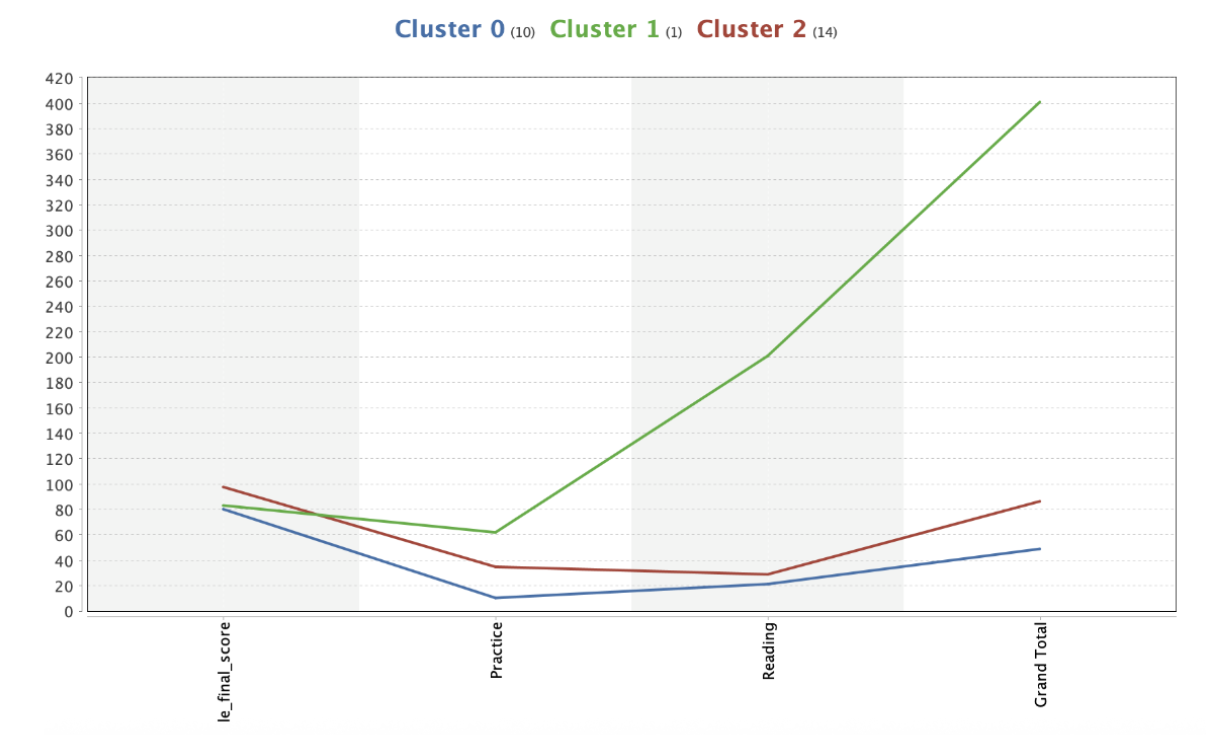
Collaborative Case Studies: Three cases involving the application and evaluation of prediction models, structure discovery models, and relationship mining in RapidMiner.
This three-part assignment uses regression, decision trees, association rule mining, and k-means clustering to examine student frustration, confidence patterns, nd online engagement. Designed for educational decision-makers, it applies statistical and data-mining methods to address how learners interact and succeed. Using tools such as RapidMiner and LMS datasets, I collaboratively demonstrated skills in model building, clustering, and ethical data interpretation. The findings reveal meaningful patterns in hint use, confidence change, and engagement behaviors. Through this process, I strengthened my analytical reasoning, data-preparation skills, and understanding of ethical considerations in learning analytics.
-
![]()
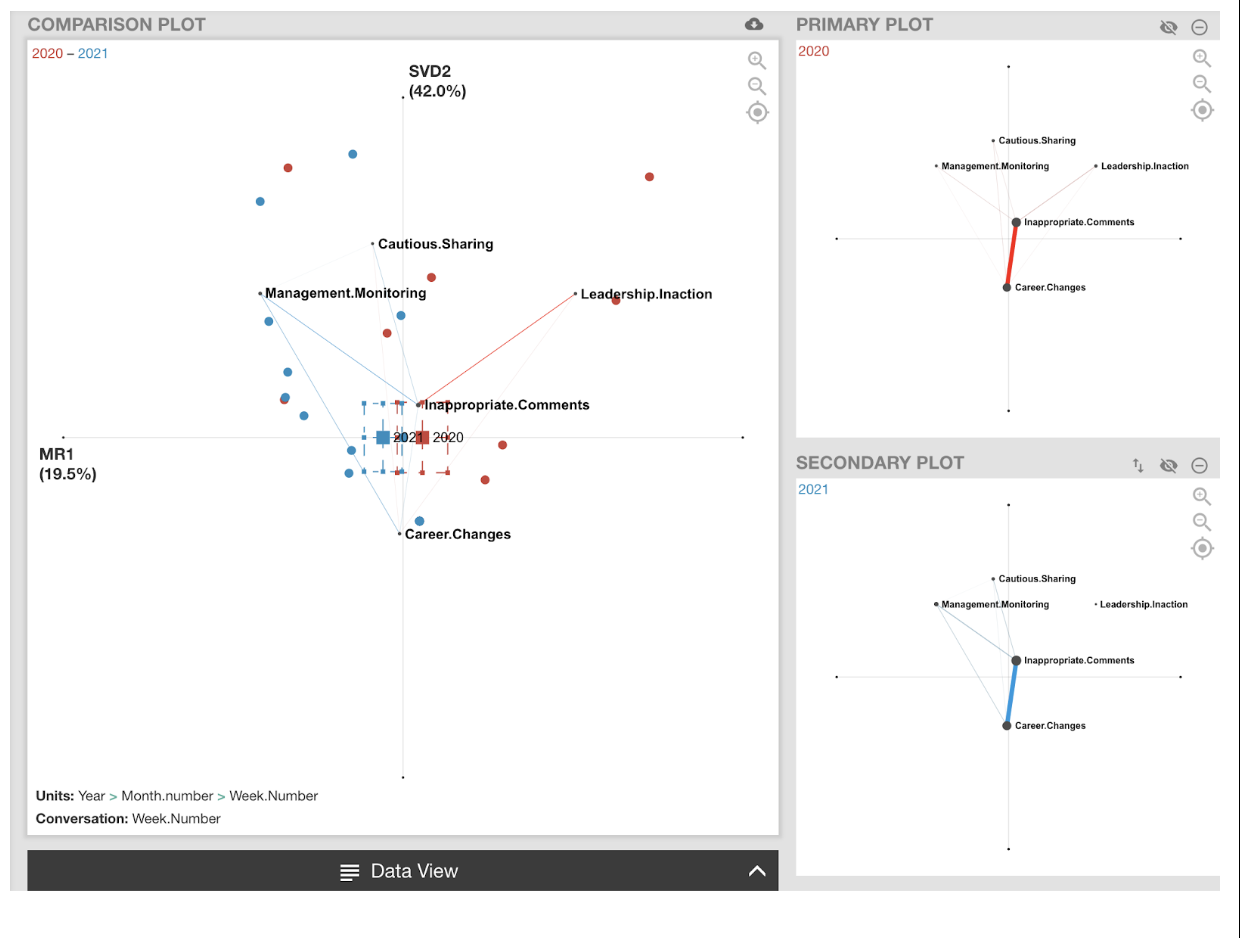
Changes in Museum Employee Experience Reporting: A Quantitative Ethnography study (i.e., quantitative analysis using qualitative data) using the nCoder learning analytics platform.
This study uses Epistemic Network Analysis (ENA) to examine how museum employees’ workplace experiences shared on a public social media platform changed over time. In 2020, posts most often connected inappropriate comments with leadership inaction, while by 2021, they more strongly reflected management monitoring and cautious sharing. A two-sample t-test confirmed these shifts were statistically significant. Qualitative examples further illustrate how initially open accounts of misconduct and inaction became more guarded as employees grew aware of organizational surveillance. These findings demonstrate how monitoring can constrain employee expression in anonymous forums, reshaping how individuals participate in digital communities of practice and ultimately limiting the potential for open dialogue and institutional accountability.
Growth in Practice: Non-cognitive skills for music therapy students
A backwards design plan for a unit of instruction that integrates learning analytics data, including a pilot launch.
This project presents a learning experience designed for junior-level music therapy students to develop non-cognitive skills, specifically growth mindset and self-awareness, to strengthen professional resilience. Created for the University of Louisville practicum 1 cohort, the module uses lectures, reflection tools, case studies, and role-play to address gaps in students’ feedback processing, self-assessment, and balanced goal-setting. Through this design process, I applied instructional design concepts, learning analytics, and reflective practice frameworks. Findings highlight how structured reflection and feedback integration can meaningfully support emerging clinicians’ long-term growth.